Contents
Getting Started

The MapLarge Javascript API is a client side library used to create maps and layers. The API interacts with MapLarge web services and runs on top of many other mapping APIs including Google Maps, Leaflet, and ESRI.

Simple Getting Started Example

  1. <html>
  2. <head>
  3. <script type="text/javascript" src="http://my.maplarge.com/JS"></script>
  4. <script type="text/javascript">
  5. ml.onload(function() {
  6. var map = ml.map("mapDiv");
  7. });
  8. </script>
  9. </head>
  10. <body>
  11. <div id="mapDiv" style="width:100%;height:100%;"></div>
  12. </body>
  13. </html>
Loading the MapLarge API
To load the MapLarge API, simply include the MapLarge javascript file.

In the script tag is a URL with the location of the file that contains the MapLarge JS API. This script tag is required.

  1. <html>
  2. <head>
  3. <script type="text/javascript" src="http://my.maplarge.com/JS"></script>
  4.  
Note: If directed to a specific MapLarge server, specify it in the URL.

Creating JSON with Map Editor

Almost all MapLarge API calls can also be configured without coding by using the advanced MapEditor.

Use MapEditor to create and edit maps and layers or for capturing code snippets for use in custom JavaScript.

Open MapEditor by adding ?showeditor=true to the map URL. MapEditor can also be opened by pressing CTRL + BACKSPACE.

Note: Replace my.maplarge.com with your server if hosted in another location.

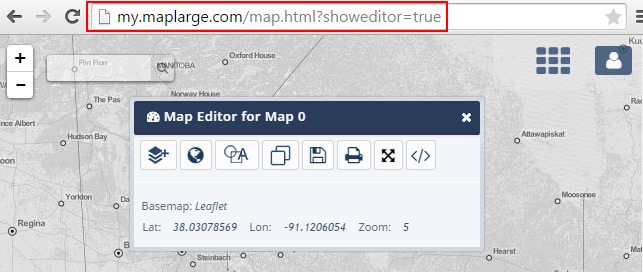
The JSON object shown in the Map or Layer JSON editor is simply a valid options object that may be passed into the constructor for a map or layer.

The Map JSON Includes attributes including the basemap, zoom level, map center position and all included Layers. The Layer JSON only includes JSON relevant to that specific layer.

Access the JSON by pressing the View/Edit JSON button on a Map or Layer in MapEditor.
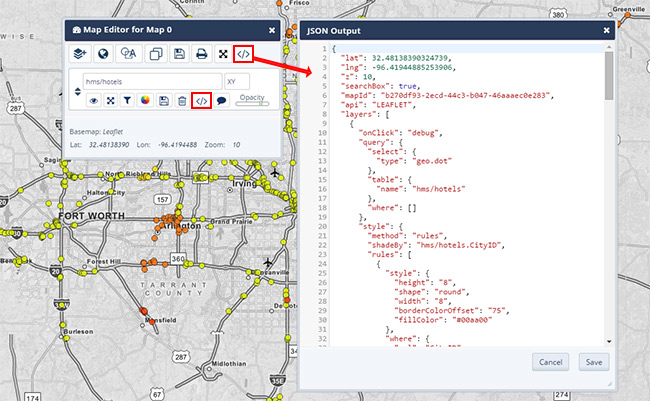
Advanced Map Editor JSON View


Creating a Map

This example shows how to create a map with a specific latitude, longitude, and zoom. The map object is used in the examples below. More details about map options can be found here.

Creating a Map Example
  1. <script type="text/javascript" src="/JS"></script>
  2. <script type="text/javascript">
  3. //ml.onload only runs after DOM is loaded
  4. ml.onload(function() {
  5.  
  6. //DOM element where map will be craeted
  7. var divID = 'mapDiv';
  8.  
  9. //Map options
  10. var options = {
  11. lat: 33.709,
  12. lng: -84.404,
  13. z: 9
  14. };
  15.  
  16. //Create the map
  17. var map = new ml.map(divID, options);
  18. });
  19. </script>
  20. <body>
  21. <div id="mapDiv" style="width:100%;height:100%;"></div>
  22. </body>
Example Map

Creating a Layer

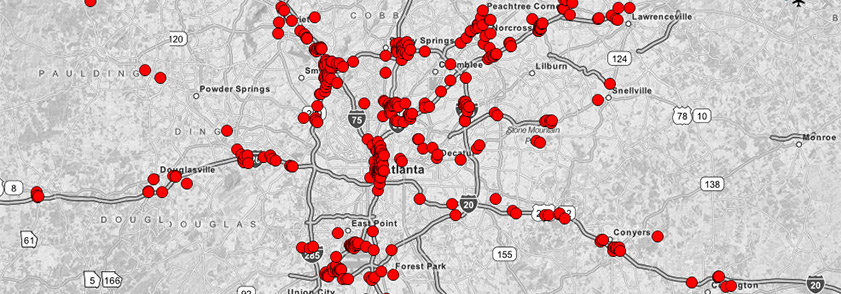
Layers also have their own set of options, similar to maps. This example creates a dot layer from the table "hms/hotels".

Creating a Layer Example
  1. //Configure the data the layer will visualize
  2. var layerOptions = {
  3. "query": {
  4. "select": {
  5. "type": "geo.dot"
  6. },
  7. "where": [],
  8. "table": {
  9. "name": "hms/hotels"
  10. }
  11. }
  12. };
  13.  
  14. //Add the layer to your map
  15. var layer = new ml.layer(map, layerOptions);
  16.  
  17. //Show the layer
  18. layer.show();
Example Map

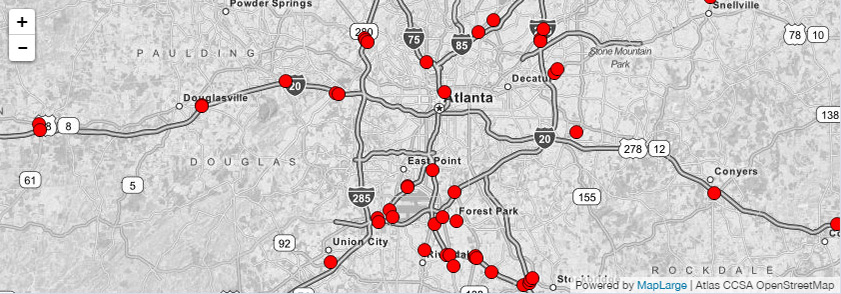
Filtering Layer Data

This is the same layer object but now filtering options have been added. This layer will only show hotels with a cost less than $50.

Learn more about the MapLarge Where Clause.
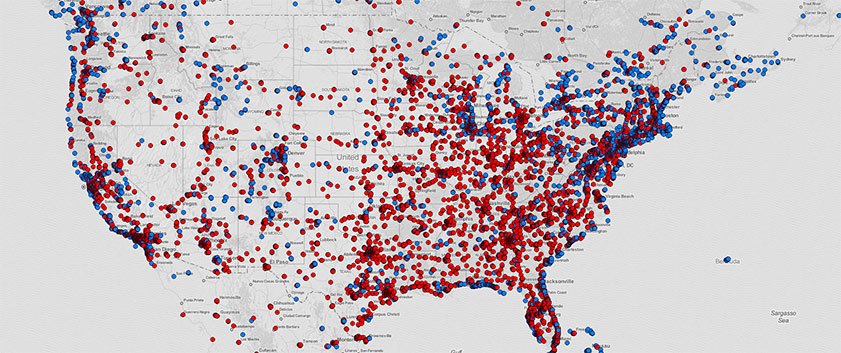
Creating a Layer with Filtering
  1. var layerOptions = {
  2. "query": {
  3. "select": {
  4. "type": "geo.dot"
  5. },
  6. "where": [
  7. [{
  8. "col": "LowRate",
  9. "test": "Less",
  10. "value": "50"
  11. }]
  12. ],
  13. "table": {
  14. "name": "hms/hotels"
  15. }
  16. }
  17. };
  18.  
  19. //Add the layer to your map
  20. var layer = new ml.layer(map, layerOptions);
  21.  
  22. //Show the layer
  23. layer.show();
Example Map

Styling Layer Data

Styling options can be added to a layer. This example shows hotels under $100 as red points and hotels over $100 as blue points.
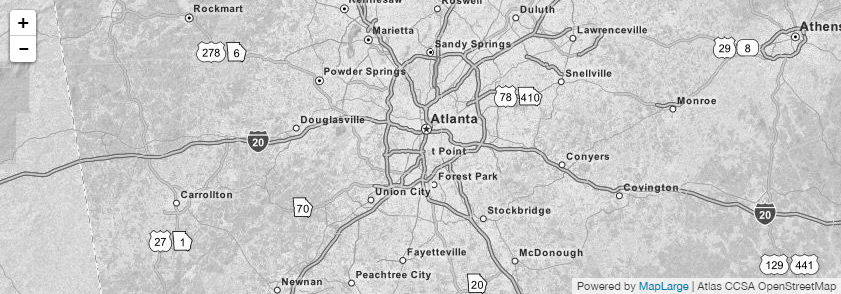
Styling Data Example
  1. "style": {
  2. "borderColorOffset": "75",
  3. "dropShadow": "false",
  4. "fillColor": "255-0-127-255",
  5. "height": "8",
  6. "shape": "round",
  7. "width": "8"
  8. },
  9. "where": [
  10. [
  11. {
  12. "col": "LowRate",
  13. "test": "Greater",
  14. "value": "100"
  15. }
  16. ]
  17. ]
  18. },
  19. {
  20. "style": {
  21. "borderColorOffset": "75",
  22. "dropShadow": "false",
  23. "fillColor": "255-255-0-0",
  24. "height": "8",
  25. "shape": "round",
  26. "width": "8"
  27. },
  28. "where": [
  29. [
  30. {
  31. "col": "LowRate",
  32. "test": "LessOR",
  33. "value": "100"
  34. }
  35. ]
  36. ]
  37. }
  38. ],
  39. "colorTransform": {
  40. "alpha": 1
  41. }
  42. },
Example Map
Complete Code Example with Filters and Styles
  1. <html>
  2. <head>
  3. <script type="text/javascript" src="/JS"></script>
  4. <script type="text/javascript">
  5. ml.onload(function() {
  6. var map = ml.map("mapDiv",
  7. {
  8. "api": "LEAFLET",
  9. "drawingEditingEnabled": true,
  10. "drawingToolsHidden": true,
  11. "drawings": [],
  12. "lat": 38.048091067457236,
  13. "layers": [
  14. {
  15. "query": {
  16. "select": {
  17. "type": "geo.dot"
  18. },
  19. "where": [
  20. [
  21. {
  22. "col": "LowRate",
  23. "test": "LessOR",
  24. "value": "100"
  25. }
  26. ],
  27. [
  28. {
  29. "col": "LowRate",
  30. "test": "Greater",
  31. "value": "100"
  32. }
  33. ]
  34. ],
  35. "table": {
  36. "name": "hms/hotels"
  37. }
  38. },
  39. "style": {
  40. "method": "rules",
  41. "rules": [
  42. {
  43. "style": {
  44. "borderColorOffset": "75",
  45. "dropShadow": "false",
  46. "fillColor": "255-0-127-255",
  47. "height": "8",
  48. "shape": "round",
  49. "width": "8"
  50. },
  51. "where": [
  52. [
  53. {
  54. "col": "LowRate",
  55. "test": "Greater",
  56. "value": "100"
  57. }
  58. ]
  59. ]
  60. },
  61. {
  62. "style": {
  63. "borderColorOffset": "75",
  64. "dropShadow": "false",
  65. "fillColor": "255-255-0-0",
  66. "height": "8",
  67. "shape": "round",
  68. "width": "8"
  69. },
  70. "where": [
  71. [
  72. {
  73. "col": "LowRate",
  74. "test": "LessOR",
  75. "value": "100"
  76. }
  77. ]
  78. ]
  79. }
  80. ],
  81. "colorTransform": {
  82. "alpha": 1
  83. }
  84. },
  85. "visible": true,
  86. "onClick": "debug",
  87. "hashcode": "0a84d8eebbb54e7bf163d68734924899",
  88. "hoverFieldsCommaDel": "",
  89. "id": "layerml_3",
  90. "opacity": "1.0",
  91. "type": "layer",
  92. "zIndex": "1"
  93. }
  94. ],
  95. "lng": -95.3173828125,
  96. "mapId": "7caff9a1-16e5-46ce-83b9-c38b75138598",
  97. "searchBox": true,
  98. "z": 5
  99. });
  100. });
  101. </script>
  102. </head>
  103. <body>
  104. <div id="mapDiv" style="width:100%;height:100%;"></div>
  105. </body>
  106. </html>

More Examples

Looking at examples is a great way to get more comfortable with what is possible with our API. You can press ctrl + M on any of these example maps to open up Map Editor so you can look at the JSON that was used to create that map.