.orderby()

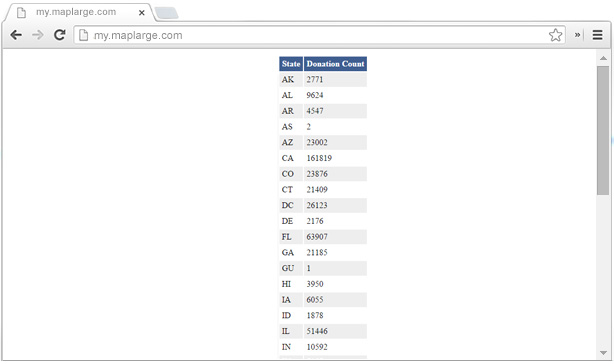
The orderby method can be used to sort the result-set by one or more columns. Grouping and subtotals are calculated first and then ordering takes place.

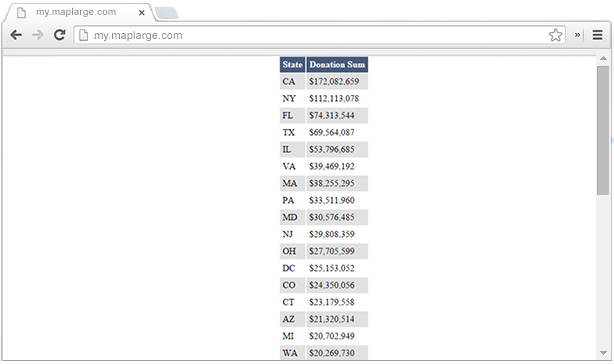
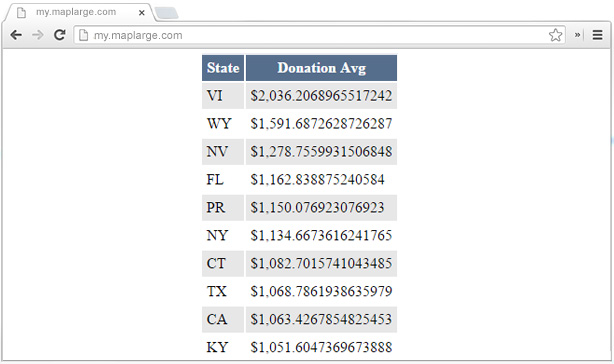
orderby sorts the records in ascending order by default. Use desc to sort the records in a descending order.

Syntax .orderby(columnName: string) Example
  1. var q = ml.query().from('Example/CampaignDonors');
  2. q.select('State','Amount');
  3. q.orderby('Amount.desc');
  4. q.run(function (data, query)
Demos Orderby Amount
  1. <html>
  2. <head>
  3. <script type="text/javascript" src="/JS"></script>
  4. <script type="text/javascript">
  5. ml.onload(function () {
  6. var q = ml.query().from('Example/CampaignDonors');
  7. q.select('State','Amount');
  8. q.orderby('Amount.desc');
  9.  
  10. q.run(function (data, query) {
  11.  
  12. var dataDiv = document.getElementById("dataDiv");
  13.  
  14. var html = '<table><tr><th>State</th><th>Amount</th></tr>';
  15.  
  16. for(var i = 0; i < data.data.State.length; i++){
  17. html += '<tr><td>' + data.data.State[i] + '</td>';
  18. html += '<td>' + data.data.Amount[i] + '</td></tr>';
  19. }
  20.  
  21. html += '</table>';
  22. dataDiv.innerHTML = html;
  23. });
  24.  
  25. });
  26. </script>
  27. <style>
  28. table tr:nth-child(even) {
  29. background-color: #eee;
  30. }
  31. table tr:nth-child(odd) {
  32. background-color:#fff;
  33. }
  34. table th {
  35. background-color: rgb(63, 94, 144);
  36. color: white;
  37. padding: 5px;
  38. }
  39. table td {
  40. padding: 5px;
  41. }
  42. </style>
  43. </head>
  44. <body>
  45. <div id="dataDiv"></div>
  46. </body>
  47. </html>
  48.  

Total State Donations, Grouped by State and Ordered by Sum, desc
  1. <html>
  2. <head>
  3. <script type="text/javascript" src="/JS"></script>
  4. <script type="text/javascript">
  5. ml.onload(function () {
  6. var q = ml.query().from('Example/CampaignDonors');
  7.  
  8. // choose the columns to return
  9. q.select('State','Amount.sum');
  10.  
  11. // group the data
  12. q.groupby('State').orderby('Amount.sum.desc');
  13.  
  14. // execute the query and process the return with the callback
  15. q.run(function (data, query) {
  16.  
  17. // get a reference to the element that will house our HTML table
  18. var dataDiv = document.getElementById("dataDiv");
  19.  
  20. // build the HTML table
  21. var html = '<table><tr><th>State</th><th>Donation Sum</th></tr>';
  22.  
  23. for(var i = 0; i < data.data.State.length; i++){
  24. html += '<tr><td>' + data.data.State[i] + '</td>';
  25. html += '<td>$' + ml.util.addCommas(data.data.Amount_Sum[i]) + '</td></tr>';
  26. }
  27.  
  28. html += '</table>';
  29. dataDiv.innerHTML = html;
  30. });
  31. });
  32. </script>
  33. <style>
  34. table tr:nth-child(even) {
  35. background-color: rgb(231, 231, 231)
  36. }
  37. table tr:nth-child(odd) {
  38. background-color:#fff;
  39. }
  40. table th {
  41. background-color: rgb(86, 110, 140);
  42. color: white;
  43. padding: 5px;
  44. }
  45. table td {
  46. padding: 5px;
  47. }
  48. </style>
  49. </head>
  50. <body>
  51. <div id="dataDiv"></div>
  52. </body>
  53. </html>

Top Ten Avg Donations, Grouped by State and Ordered by Avg Donation
  1. <html>
  2. <head>
  3. <script type="text/javascript" src="/JS"></script>
  4. <script type="text/javascript">
  5. ml.onload(function () {
  6. var q = ml.query().from('Example/CampaignDonors');
  7.  
  8. // choose the columns to return
  9. q.select('State','Amount.avg');
  10.  
  11. // group the data
  12. q.groupby('State').orderby('Amount.avg.desc').take('10');
  13.  
  14. // execute the query and process the return with the callback
  15. q.run(function (data, query) {
  16.  
  17. // get a reference to the element that will house our HTML table
  18. var dataDiv = document.getElementById("dataDiv");
  19.  
  20.  
  21. // build the HTML table
  22. var html = '<table><tr><th>State</th><th>Donation Avg</th></tr>';
  23.  
  24. for(var i = 0; i < data.data.State.length; i++){
  25. html += '<tr><td>' + data.data.State[i] + '</td>';
  26. html += '<td>$' + ml.util.addCommas(data.data.Amount_Avg[i]) + '</td></tr>';
  27. }
  28.  
  29. html += '</table>';
  30. dataDiv.innerHTML = html;
  31. });
  32. });
  33. </script>
  34. <style>
  35. table tr:nth-child(even) {
  36. background-color: rgb(231, 231, 231)
  37. }
  38. table tr:nth-child(odd) {
  39. background-color:#fff;
  40. }
  41. table th {
  42. background-color: rgb(86, 110, 140);
  43. color: white;
  44. padding: 5px;
  45. }
  46. table td {
  47. padding: 5px;
  48. }
  49. </style>
  50. </head>
  51. <body>
  52. <div id="dataDiv"></div>
  53. </body>
  54. </html>