Network Graph Analytics
Network Data Exploration
Visualize and Analyze Large Networks
Visualize both logical and physical connections between entities simultaneously to see the larger patterns in your data. Interactively visualize graph and map data at unprecedented scale with real time zoomable data where every record triggers dynamic hover and click events. Filter data with smart queries that apply to both graph and map to help analysts zero in on key patterns.
Directly and indirectly networks pervade our daily lives. Most of us are dependent on technological networks, energy networks, and biological networks. We expect our cell phones to work when we need to make a call and we rely on electricity to use our computers, watch tv, and keep our food cold in the refrigerator. Many of us choose to participate in social networks and use information networks for almost instantaneous answers to a multitude of questions. Facebook, Twitter, LinkedIn, and Wikipedia have become household names. With all these networks generating useful and marketable information, analysts need a way to harness and evaluate this data to make effective decisions. Graphs are a powerful visual tool used to display and analyze sophisticated networks. Very complex and valuable questions can be answered in real time with network graphs while colors, design elements and format can all be customized to enhance visualization. Network graphs can be used to create dynamic network data models, to identify patterns and relationships, to locate trends in performance, to optimize routing, and to share information with millions of users simultaneously.
Visualize both Logical and Physical connections between Entities simultaneously to see the larger patterns in your data. Interactively visualize graph and map data at unprecedented scale with real time zoomable data where every record triggers dynamic hover and click events. Filter data with smart queries that apply to both graph and map to help analysts zero in on key patterns.
Physical
MapLarge provides network-based spatial analysis, such as routing, fleet routing, travel directions, closest facility, and service area. Develop networks from your GIS data by using an advanced network data model allowing for realistic network conditions.
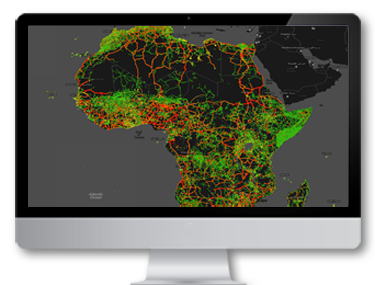
Physical Network Graph Examples
- Find shortest routes.
- Produce the most efficient routes for a fleet of vehicles that must visit many locations.
- Use time windows to limit when vehicles can arrive at locations.
- Locate closest facilities.
- Determine optimal locations for facilities by performing a location-allocation analysis.
- Define service areas based on travel time or distance.
- Create a network using your existing GIS data.
- Generate a matrix of network travel costs from each origin to all destinations.
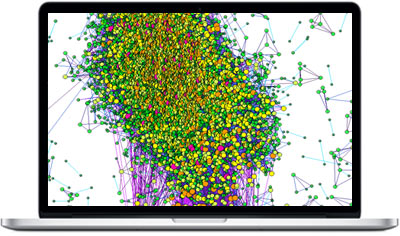
Logical
Logical networks are an abstract representation of a network. These networks are not dependent on geometry or location of the elements. Social networks, biological networks, and information networks are examples of logical networks. The structure consists of individuals called “nodes”.
Logical Network Graph Examples
- Exploratory Data Analysis: intuition-oriented analysis by networks manipulations in real time.
- Link Analysis: revealing the underlying structures of associations between objects, in particular in scale-free networks.
- Social Network Analysis: easy creation of social data connectors to map community organizations and small-world networks.
- Biological Network analysis: representing patterns of biological data.
Visualize both Logical and Physical connections between Entities simultaneously to see the larger patterns in your data. Interactively visualize graph and map data at unprecedented scale with real time zoomable data where every record triggers dynamic hover and click events. Filter data with smart queries that apply to both graph and map to help analysts zero in on key patterns.