Data Visualization Mapping Software
Detecting patterns in Big Data is a challenge when viewing aggregate data. With MapLarge, analysts can view much higher resolutions leading to greater insights in less time. Users can query against any combination of dimensions and visualize their data instantly.
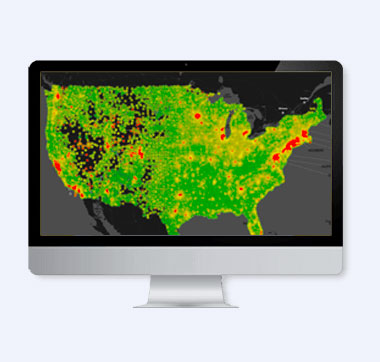

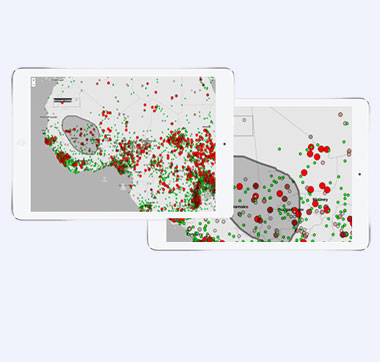
Heat Maps
A visual representation of data using colors. Heat maps can be used with many types of data, from representing the number of foreclosures to the spreads of infectious diseases.
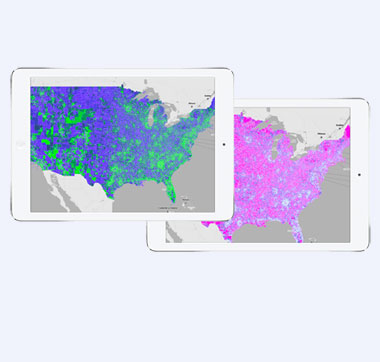
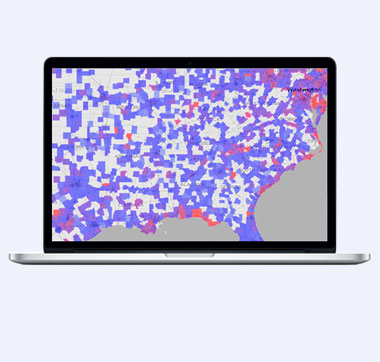
Choropleth Maps
Choropleth maps provide an easy way to visualize how a measurement varies across a geographic area. Polygons are shaded or patterned in proportion to the measurement of the statistical variable being displayed on the map.
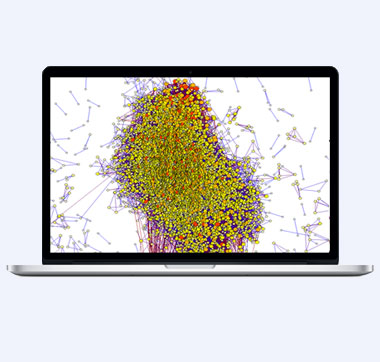
Logical Network Graphs
Logical network graphs can be used to model relations and processes in physical, biological, social and information systems. Graphs are created by using a dot or circle for every vertex and by drawing an arc between two vertices if they are connected by an edge.
Network Graphs
Network graphs are used for spatial analysis, such as routing, fleet routing, travel directions, closest facility, and service area. Use an advanced network data model to allow for realistic network conditions.
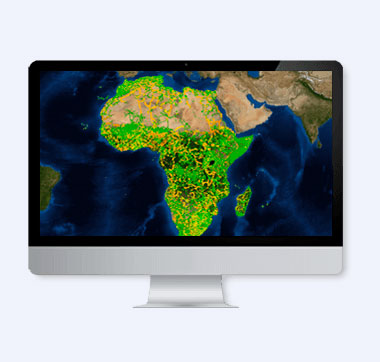
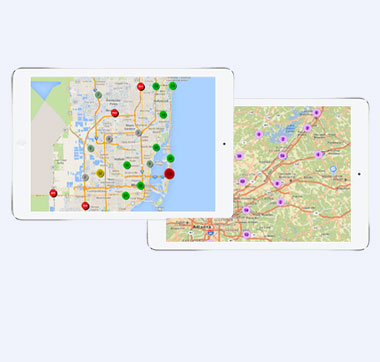
Clustering
Simplify data visualization by combining data that are nearby each other on the map and display as a cluster. Useful for identifying the locations of statistically significant hot spots, cold spots, or spatial outliers.
Synchronized Maps
Synchronize multiple maps. Zoom in or out on one map and the other maps will also zoom in or out. Synchronize a map with a chart and as the map is changed with onclick or onhover events, the chart will change in unison.
Annotate Editable Maps
Make annotations and draw on the map with various shapes and lines. Annotations are useful to call out specific addresses, points of interest, and other types of destinations. Highlight focus or marketing areas by drawing circles or rectangles.